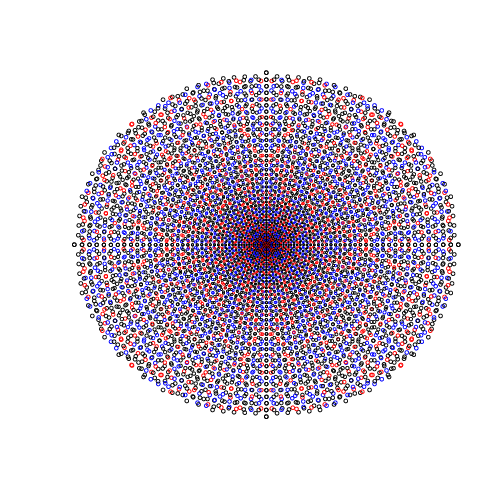
Talking with David Earn and Ben Bolker about simple, mathy programs that make nice pictures (for pedagogical reasons).
David suggested plotting Pythagorean triples. He said to reduce them to rationals, but I couldn’t figure out a good way to do that (the natural way just produces points on a circle), so I stuck with the integers.
This code plots (a, b) from Pythagorean triples , for . The circles get bigger at rate (chosen arbitrarily and kind of looks nice). The box goes from (-50, 50) on each axis. It has some nice patterns.

pdf version. (Looks nice, embiggens nicely.)
There are two natural ways to interpret these points: as pairs of integers, or (cooler) as complex integers (see also my post about factoring in the complex plane). There are three natural ways to think of the points that are not on the axes, and three corresponding ways to decide which points to plot on the axes:
- If we think of the points as representing Pythagorean triples, in the classic sense, the axes should have no points. This is the first way I made the plot, because that was what was suggested.
- If we think of the points as representing points on the integer lattice that are an integral distance from the origin, the points off the axes remain unchanged, but we should put a point at each lattice point on the axes.
- Finally, if we think of the points as representing square numbers in the complex plane, we should put points at square locations on one of the axes (conventionally, the horizontal axis), but not the other.
Based partly on suggestions from Ethan Bolker, I colored the points:
- black for “imprimitive” triples (ones which can be generated as integer multiples of other triples)
- blue for primitive triples which can be factored into other triples in the complex plane
- red for triples which are prime even in the complex plane (ie., they represent complex integers which are squares of primes)